
Dun Laoghaire Case Study: Impact of Cycling Infrastructure Investment
In this special edition of our members insights blog series, we’re taking a detailed look at the impact of cycling infrastructure investment on cycling in Dun Laoghaire, Dublin.
This analysis has been provided by See.Sense, our Official Bicycle Lights and Data Insights Supplier. When using your See.Sense bike lights, patented sensor technology inside the lights can detect the challenges you face on your ride. By sharing anonymised data insights, the See.Sense community has enabled the analysis below.
Background
In the summer of 2020, segregated cycling infrastructure was installed along the Dún Laoghaire coastal road between Forty-Foot at Sandycove and the Newton Avenue/Seapoint Avenue junction at Blackrock.
The success of this route has been striking. Delivered in just eight weeks at the beginning of lockdown, the route recorded 2 million cycling and walking trips in its first year, and has recently been awarded a 2022 Cycling Infrastructure Award by the European Cycling Federation. Due to this, the route provides us with a perfect Case Study to analyse the impact of cycling infrastructure investment, since we have data in this location before the installation, providing an effective ‘baseline’ for a before and after comparison.
Our analysis adds a new perspective that goes beyond providing a simple ‘count’ of the numbers of cyclists using the infrastructure, and provides insights about the quality of the route and the experience of cyclists who ride on it. See.Sense gathers insights into previously unreported events such as braking, swerving and road surface data, and uses these insights to shine a light on not only the comfort of cyclists using the route, but also their overall safety. By monitoring and evaluating routes using these factors, we can understand how inclusive a route is to a wide range of riders - something that's ultimately crucial to achieving successful cycling infrastructure.
A map of all the current cycling infrastructure in the Dún Laoghaire-Rathdown harbour area is shown in Figure 1 (below). For this blog, we will focus our attention on the new segregated infrastructure installed between Seapoint and Forty-Foot.
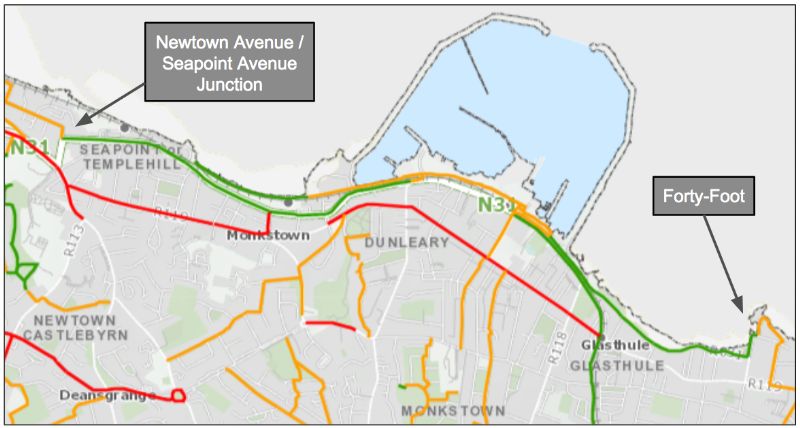
Figure 1. Cycling infrastructure in Dún Laoghaire-Rathdown. Green routes indicate roads with segregated cycling infrastructure. Amber routes are deemed low traffic routes. Red routes are busy traffic routes. Map courtesy of Active School Travel.
Notes about the analysis.
The new infrastructure was installed in July 2020, so in order to create equal conditions for our before and after analysis, we selected two equal blocks of time before and after the installation of the new infrastructure. The pre-infrastructure data covers a 22-month period of 1st August 2018 to 31st May 2020, whilst the post-infrastructure data covers an equal period from 1st August 2020 to 31st May 2022. This was in an effort to have data blocks that shared similar environmental conditions i.e. seasonal conditions such as daylight hours and weather, holiday periods, etc. The data shown in the analysis is aggregated data, which not only protects rider anonymity, but also has the benefit of giving a fairer reflection of how the wider riding community experience the same locations along a route.
Route Popularity
First of all in our before-after analysis, we will take a look at where people are riding, and how the general route selection by cyclists has been influenced by the installation of the new segregated cycling lanes.
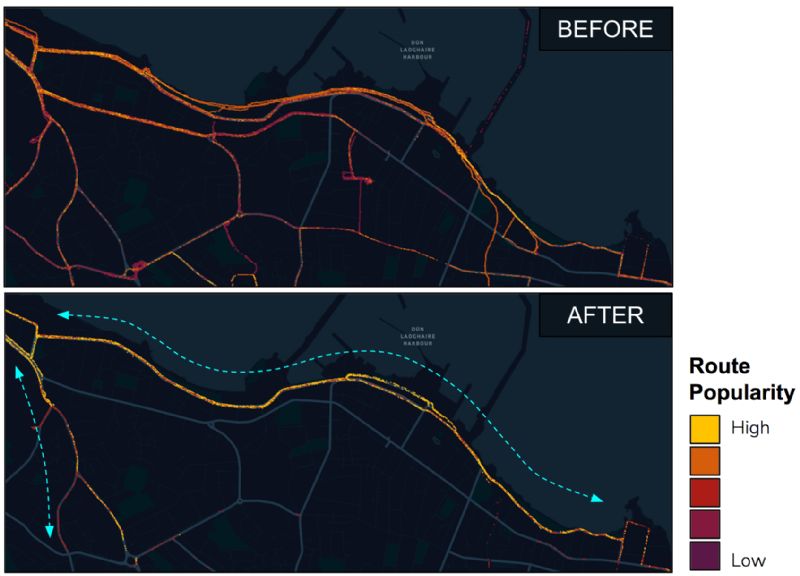
Figure 2.
Looking at the datamaps in Fig. 2. above, we can see that a dramatic change has occurred in route popularity. Before the new infrastructure, a lot of the roads in Dún Laoghaire were being used by cyclists, with the heaviest traffic along the coastline and the roads in the north-west of the map. However, with the installation of the new infrastructure, we can see a consolidation in route selection, with cyclists choosing to ride along two main arterial routes (indicated with the blue dashed arrows in Fig. 2.); one a north-south route (along Temple Hill and Stradbrook Road), and the other being the new cycling infrastructure along the coastline.
Before the new infrastructure, it can be seen that some riders were using various paths, such as the segregated path alongside the railway line, and then joining/leaving the coastal road to continue their journeys. Now, with the new infrastructure, people are riding the full extent of the road, no longer making detours. This suggests that many riders were previously trying to take less stressful, traffic free routes, but are now benefiting from the feeling of safety and convenience afforded by the segregated cycle lane.
Average Speed
Next we’ll have a look at how cycling speed along the route has been affected.
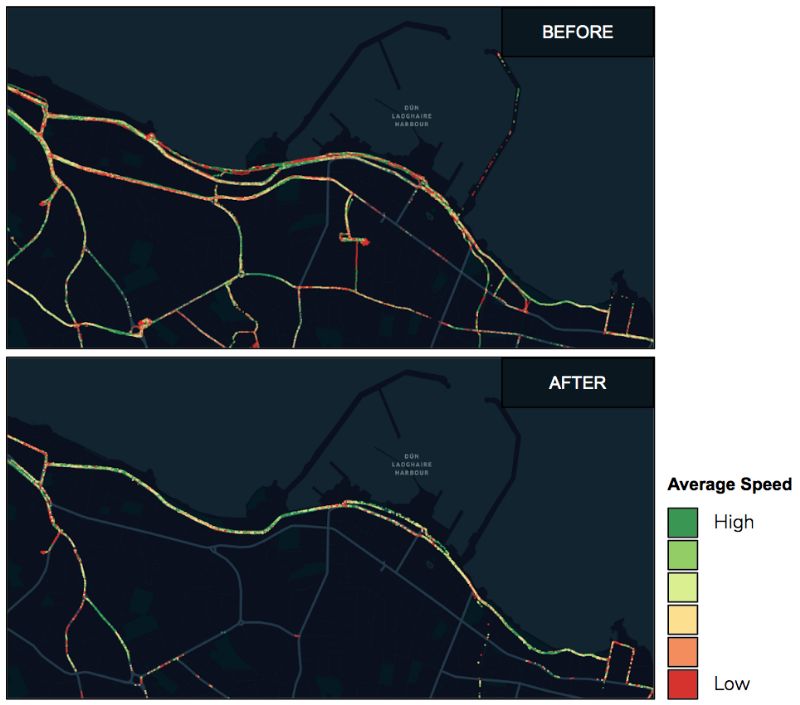
Figure 3.
Prior to the new infrastructure, it can be seen that the average speed of cyclists along the coastal route fluctuated quite a lot. However, after the installation of the new infrastructure, a noticeable difference is seen. With the new infrastructure, we observe an increase in green colouration along the coastal road, indicating that the average speed along the route has improved, being more consistent (less fluctuation), and generally faster. There are some slower sections but these appear to correlate with the location of junctions and crossings, where reduced speed is expected. This gives further indication of how segregated cycle lanes allow riders to ride at a more consistent speed, without having to adjust for shared traffic.
Road Surface Roughness and Braking
Now we will look at road surface roughness and braking. We have put these two datasets side-by-side because we have noticed that some regions have quite a strong correlation between road roughness and higher braking intensity, regardless of infrastructure.
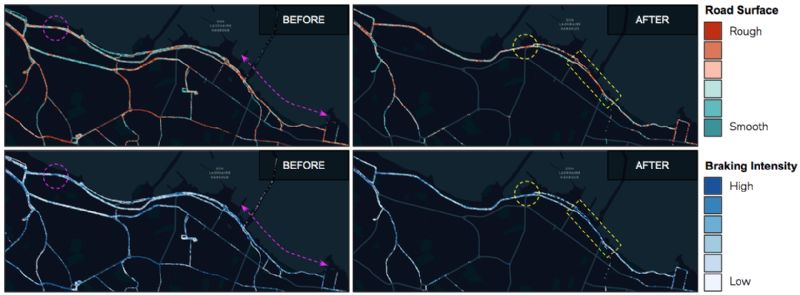
Figure 4. The top row is the road surface data before and after infrastructure, and the bottom row is braking data before and after infrastructure.
It can be seen in Fig. 4. that before the infrastructure was installed, the road surface quality was quite rough between the harbour and Forty-Foot, and that this section also had relatively higher braking (see pink dashed arrows). There was also a hotspot along Seapoint Avenue for roughness and braking (the pink dashed circles). The new infrastructure has seen a general improvement in these specific regions, as there is more consistent braking along the entire length of the coastal road. However, there are a couple of braking hotspots on the eastern side of the harbour which correspond with rough surface readings (outlined by the yellow dashed rectangles). There is another intersection where Crofton Road, Old Dunleary Road and York Road meet (marked on the map with a yellow circle). This junction is where the segregated cycling infrastructure begins on the west side of the harbour and we notice high readings for road surface roughness and braking at this point.
Along Seapoint Avenue, we can see that the road surface on the new infrastructure is a little rough, but braking along this road is relatively low despite this. It shows that people are willing to endure a slightly rougher road surface for the other benefits afforded by being segregated from motor traffic.
Conclusions
Overall, the data reveals the positive impact that this new cycling infrastructure has had on cycling in Dun Laoghaire. Cyclists are making full use of the route, and opting to largely stick to the bike path when travelling through the region. Route choice has been firmly consolidated, with the new infrastructure now acting as one of two key arterial routes in Dun Laoghaire. Importantly, this has resulted in cyclists experiencing a smoother, safer ride. The average speed is now much more consistent throughout the length of the route, and incidents of heavy braking have decreased since the summer of 2020.
It is important to note that the See.Sense data has also highlighted some areas that could be explored for potential further improvement. This is mainly around Seapoint Avenue and the junction of Crofton Road, Old Dunleary Road and York Road, where some road roughness and high levels of braking have been highlighted. High levels of braking have also been shown at the eastern side of the harbour. Exploring improvements to these areas will ensure that this new infrastructure remains inclusive for a wide range of riders - thereby maintaining the route’s status as one of Ireland’s most successful new cycling lanes.
Get Involved!
We will have more data insight member blogs coming throughout the year, so make sure to get involved by anonymously contributing your ride stats using the free See.Sense App. You need to own a See.Sense light to contribute, however Cycling Ireland Membership offers an exclusive 30% discount code off all See.Sense award-winning reactive bike lights - check your membership newsletter to find your unique code.
We hope you’ve enjoyed this latest member insights blog. If you would like to see your local cycling network analysed, make sure to put it on the map! The more insights we gather, the more detailed our analysis can be, so be sure to use your exclusive discount and hit the roads with a See.Sense light!
Not Just A Bike Light:
It's not just about the insights. If you own a See.Sense product and have joined the See.Sense community through their mobile app, you’ll see some unique and fun stats about your own rides too. These include:
The distance you've cycled
The calories you've burned
How much CO2 you’ve saved by cycling
More unique and fun stats.
Remember, all Cycling Ireland members get 30% off See.Sense lights!