
Cycling In Dublin: How Cycling Frequency Shapes Your Ride
Welcome to the latest instalment of our Member Insights Blog Series. For this month’s blog, we are examining how the ride experience of people who ride frequently - defined here as riding more than two times per week on average - compares to those who ride less frequently - defined as riding on average 1 or less days per week.
These insights have been provided by See.Sense, our Official Bicycle Lights and Data Insights Supplier, using data collected on route selection and braking in the city.
Dublin Route Selection
First off, let’s take a look at routes taken in Dublin, broken down according to the frequency that people ride.
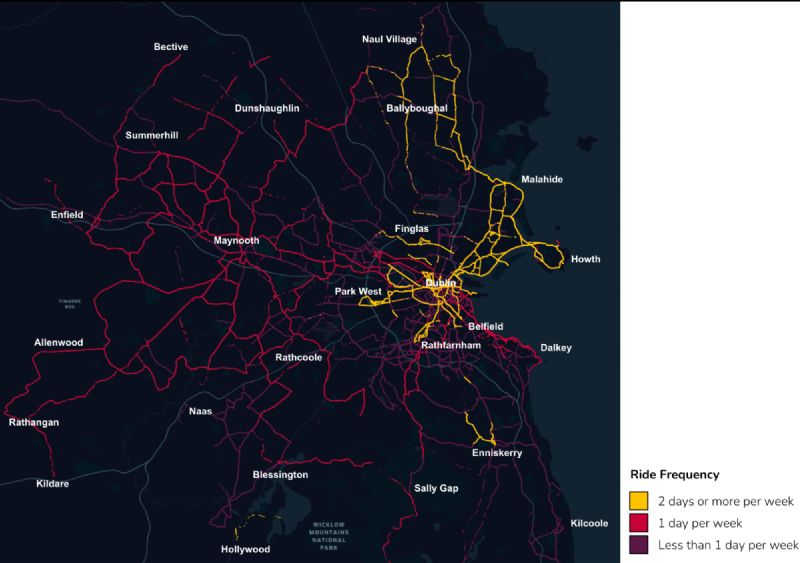
The infrequent cyclists (purple routes) can be seen to ride across large sections of the greater Dublin area. This suggests that these are more likely to be recreational cyclists who venture on a variety of routes.
The yellow routes, used by the most frequent cyclists, are concentrated much more strongly in Dublin City, but also extend into neighbouring towns and countryside, which indicates a combination of dedicated commuters and avid cyclists.
The routes chosen by the more frequent riders coalesce into arterial routes, while the infrequent riders are found on a wider variety of routes across Dublin. This suggests that the frequent riders have perhaps explored various routes, but have found and settled on preferred routes.
Dublin City Centre
Taking a closer look at the routes taken within Dublin City (map below), there is an overlap of cycle friendly infrastructure (white dashed lines) and the routes ridden by the frequent cyclist cohort.
This shows that despite being more frequent riders, for the most part they still prioritise safer and less stressful segregated routes. Another factor to be considered is that some of these routes are also quite scenic, with views along the canal networks, the River Liffey, Phoenix Park and Dublin Bay.

We can also see how the placement of the cycling infrastructure facilitates connectivity between various parts of the city, which is likely why we see such heavy traffic by frequent cyclists.
The less frequent cyclists are also seen to use the same routes taken by the frequent cyclists, but, we see more deviation from the cycling infrastructure and riding across more roads across the city.
This is likely down to two factors. Firstly, there are naturally more infrequent cyclists than avid, frequent cyclists, which will expand the numbers of routes taken. The second factor is likely due to frequent riders knowing with experience the exact routes they want to take, and sticking to friendly paths to facilitate their journeys.
Speed Comparison
We’ve taken a look at the route choices of the frequent and infrequent riders. Now, let’s see if there’s any link between ride frequency and speed.
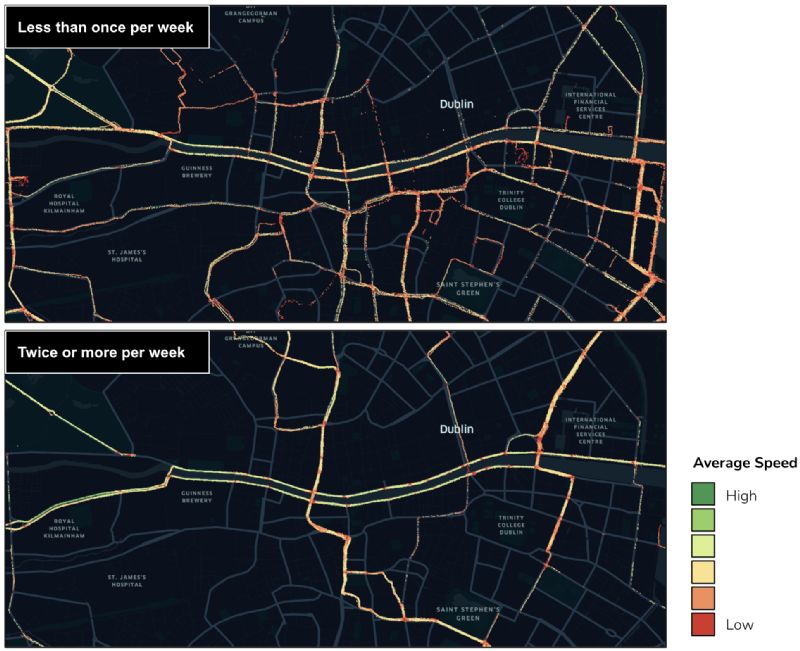
In the first map, representing less frequent cyclists (less than once a week), we can see plenty of red and yellow data points, which indicates slower speeds across most routes.
In contrast, the second map representing frequent cyclists (twice or more a week) has a much higher prevalence of green data points, which represents faster speeds. This is especially evident on the straight sections alongside the River Liffey and through Phoenix Park.
Conclusion
In conclusion, the data insights reveal distinct patterns and preferences among frequent and infrequent cyclists. Frequent cyclists tend to stick to specific, arterial routes, benefiting from their experience and knowledge of the most cycle-friendly paths. In contrast, infrequent cyclists display more variety in their route choices, often venturing off the established cycling infrastructure, possibly due to their less frequent exposure to the area's cycling dynamics.
The role of cycling infrastructure, particularly within Dublin City Centre, is crucial in shaping these patterns. We saw that cycle-friendly paths align closely with the routes preferred by frequent cyclists, emphasising their preference for safety and stress-free travel. This suggests a strong correlation between well-developed cycling infrastructure and the encouragement of regular cycling habits.
We hope you enjoyed reading - further analysis of this nature can be conducted in conjunction with a local authority partner. To see how See.Sense data has been used to help make cycling in cities safer, read here.
Get Involved!
We'll have more member insights blogs coming throughout 2024, so make sure to get involved by anonymously contributing your ride stats using the free See.Sense App. You need to own a See.Sense light to contribute, however, Cycling Ireland Membership offers an exclusive 30% discount code off all See.Sense award-winning reactive bike lights - check your membership newsletter to find your unique code.
Not Just A Bike Light
It's not just about the insights. If you own a See.Sense product and have joined the See.Sense community through their mobile app, you'll see some unique and fun stats about your own rides too. These include:
- The distance you've cycled
- The calories you've burned
- How much CO2 you've saved by cycling
- More unique and fun stats.
Remember, all Cycling Ireland members get 30% off See.Sense lights!